The value chain for textiles:

- Ginning & Pressing: Converts raw cotton to cotton fibres.
- Spinning: Converts fibres to cotton yarn.
- Weaving & Knitting: Converts yarn to fabric.
- Dyeing and finishing: Adds colour and finish to fabric.
- Garment manufacturing: Converts finished fabric into garment (with or without a design stage in between step 4 and 5)
Ambika Cotton Mills is engaged in Spinning of cotton yarn and manufacture of Knitted fabrics. The company uses high quality extra long staple cotton in its yarn manufacturing by importing Supima and Giza cotton from farmers and intermediaries in USA, Egypt and Australia. These are used for the manufacture of premium quality clothing with higher thread counts.
We know that cotton spinning is a low margin and cyclical business, with zero pricing power. Let us analyse the financial statements of Ambika Cotton Mills to validate if it is the same for the company as well.
To start off, let us analyse the PnL of the company:
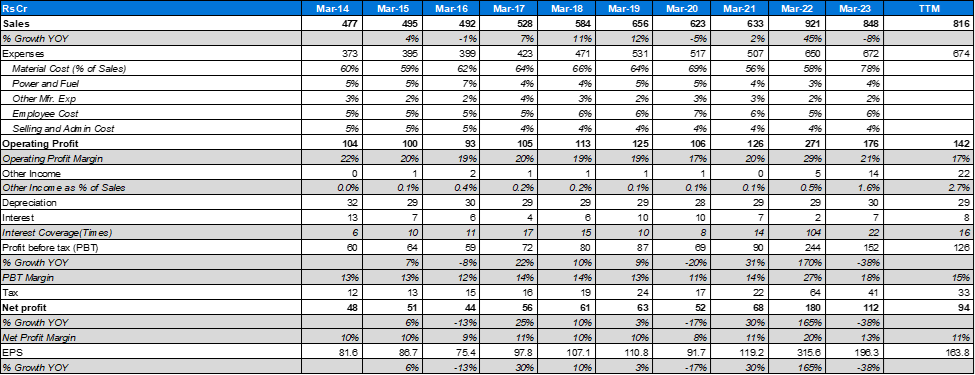
Sales:
Y-o-y sales has grown on most years, (except 2020-21 period, for covid related reasons; and then a jump in 2022 to make up for order backlogs).
However, the sales growth numbers have been disappointing.

Let us ignore the 3-year CAGR (because the base of 2020 is very low). The 5- and 9-year CAGR for sales growth is tepid, in the range of general inflation in India.
This could be because of multiple factors:
- Low demand of product/ unable to sell higher volumes at certain price.
- Limited availability of raw materials.
- Lack of management appetite to grow.
The most probable factor is number 1: Company is struggling to sell the volume it can produce. Let us delve deeper:
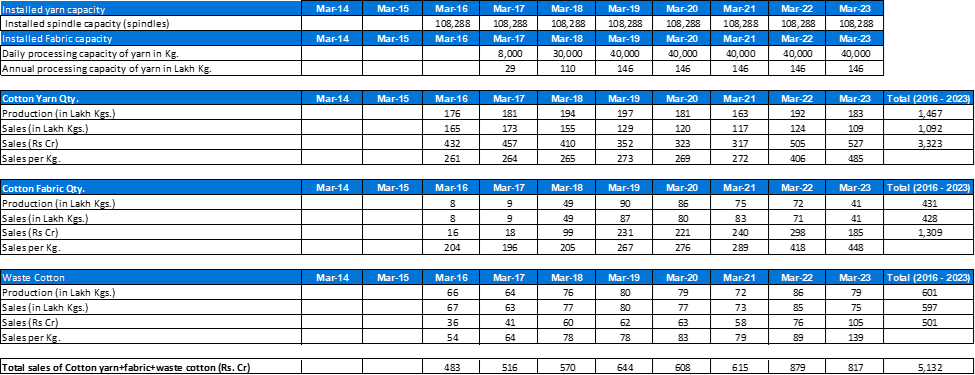
Important to note that the company has not added any spindle capacity since 2016 and fabric capacity since 2019. While the total capacity of the company is unknown, it has the ability to produce 197 Lakh Kg of cotton yarn (Mar-19 production number) and 90 Lakh Kg of cotton fabric at the very least. At 100% capacity production could be higher.
However, if we look at recent sales numbers, company has sold 109 Lakh Kg of yarn and 41 Lakh Kg of fabric in 2023. – both of which are far below full utilisation levels.
Production levels of yarn has remained on the higher side though, rarely dropping below 180 Lakh Kg over the past 7 years (discounting 2021 as the year of covid). Fabric production has slowed down in 2023, although was in the range of 70 – 90 Lakh Kg between 2019 – 2022.
What this might mean is: company produces cotton yarn at high-capacity utilisation levels. Sales is struggling because of demand related issues. Between 2016 and 2023, company has produced 1,467 Lakh Kg of cotton yarn (excluding production for internal consumption) but sold only 1,097 Lakh Kg.
25% of the production is in inventory.
So, we can conclude that the company operates their machines at high-capacity utilisation, even during periods of low demand and stores produced cotton in their inventory. (We will come back to this topic when we analyse the balance sheet).
Let us look at the share of exports and imports:

Share of exports have been in the range of 60 – 70% since 2018.
Gross Margins:
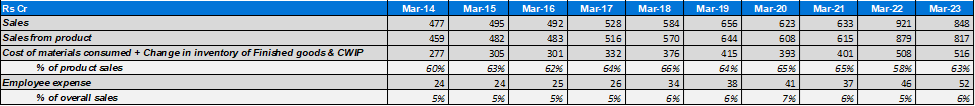
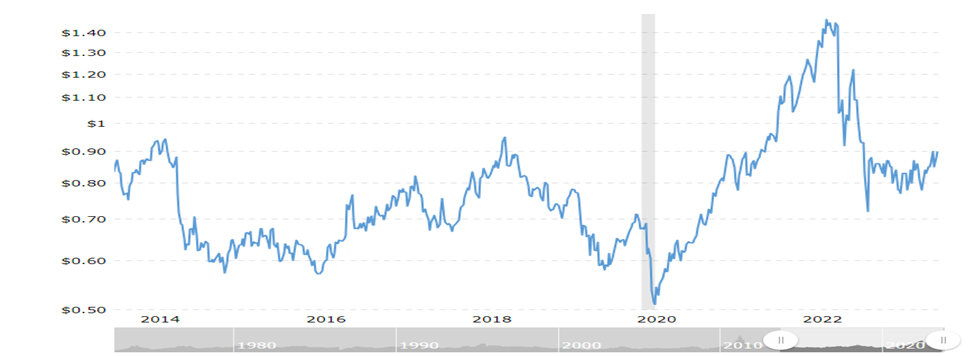
Cost of materials as a % of sales is in the range of 60 – 65 % over the past decade. Which is very impressive for a cotton spinning mill. Rarely would you come across a spinning mill, which can charge a 35 – 40% premium over their cost of goods consistently across cotton cycles. (Graph below shows raw cotton prices in USD/ pound) – this is to depict that despite fluctuating prices of raw cotton, company has been able to command a 35 – 40% premium over raw material prices. (We will look at spread between cotton and yarn prices as well).
Company has been investing in in-house solar power generation capabilities, which might reduce cost of power and fuel.
Comparative analysis:
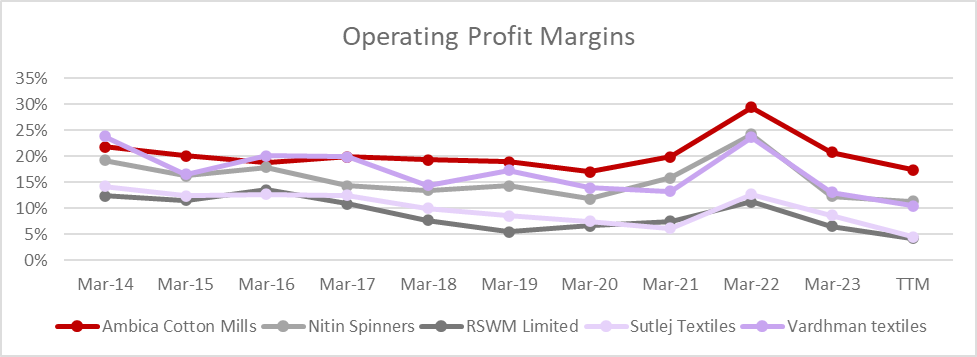
The graph shows a comparison between gross margins of some listed cotton spinners in India. (Note: not all of them are pureplay spinning mills)
As evident from the above graph, they have one of the industry’s leading operating profit margins. This comes down to two reasons:
- Premium quality of materials (Supima and Giza cotton)
- End usage is primarily clothes – shirts, which commands a higher premium compared to curtain, bedsheets etc.
How they treat their producers and customers.
Before we get into this topic, important to establish why it is an important topic.
- We can conclude from the above discussion, that Supima and Giza cotton yarn commands a higher premium compared to regular Indian cotton. Which means that the demand for such specialised cotton would also be high. Farmers in this case might chose to sell to the highest bidder. Players who primarily operate in the non-specialised cotton space MIGHT be willing to pay a premium over prevailing market prices to farmers to make inroads into the space.
Production of Giza cotton has been on a constant decline over the past 2 decades due to a combination of several factors including (but not limited to) lower yields, lower harvested area and environmental factors.
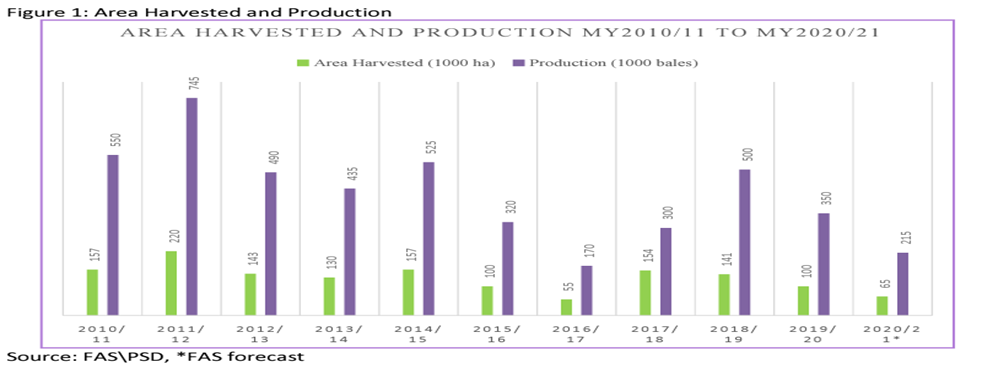
You can read more about the limited availability of Giza cotton in the following articles/ reports:
- Global Agricultural information Network: Cotton and Products report (Egyptian producers continue to cut production)
- https://www.newyorker.com/news/news-desk/the-end-of-egyptian-cotton
(There are many other reports which point to the same fact)
Similarly, Supima cotton (https://supima.com/) is a very special type of cotton grow only in specific states of USA – California, Arizona, Texas and New Mexico, due to land and weather conditions. So, it can not grow in other places.
Hence, raw material is rare commodity in this case.
The company has a very close relationship with their suppliers which they have stressed on in various annual reports. The following are two snapshots from the recently published 2023 annual report:
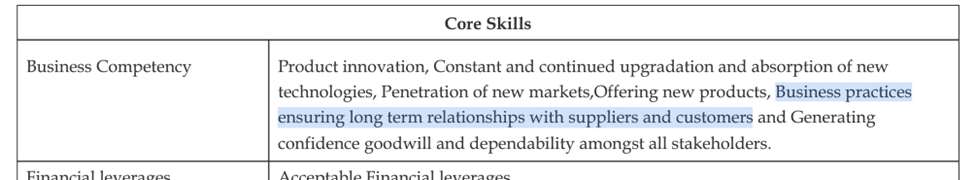
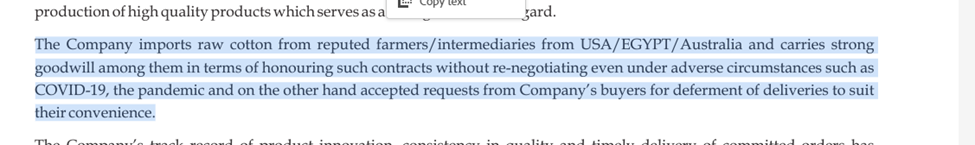
This helps the company ensure that they are able to load up on Raw material when prices are low, and not fall short of raw material availability when demand picks up.
This is extremely important, because we have witnessed in 2016 that an audit by US authorities revealed that about 89% of products marked as pure Giza cotton was blended cotton. This had a sever impact on multiple suppliers of Target, Walmart, Bed Bath and Beyond. Reputation of companies like Welspun was severely affected.
Let us analyse the Balance Sheet of the company:
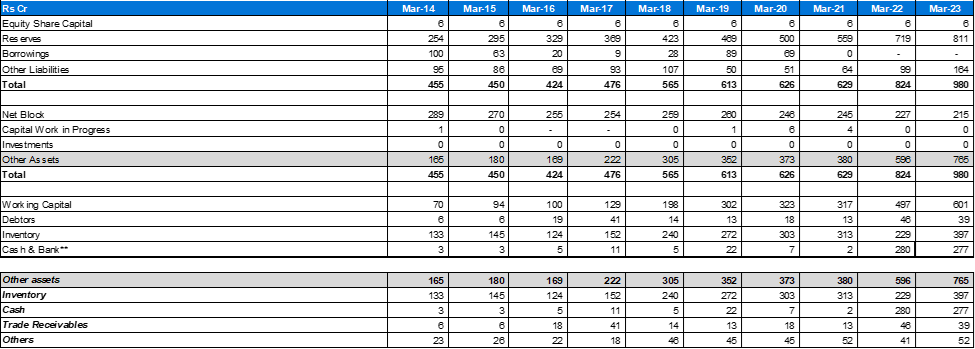
- The company has no debt on their books, which is a rare sight in the industry.
- The gross block of the company is very old. I am not sure if and to what extent this impacts their ability to operate at 100% capacity. (However, that is not a critical concern at this moment because sales are well below what can be achieved at 100% utilisation).
- Key thing to notice here is their inventory.
- Inventory has been piling up since 2018 (when they last added capacity in fabric manufacturing). Since then, production levels have been significantly higher than sales levels.
- The company had timed the market very well through 2022 when cotton prices had peaked, selling off a part of the excess inventory.
- Currently we see inventory levels are rising again as cotton prices are on the decline.
- So, the company uses cash and inventory of RM and FG interchangeably. While this provides them with operating leverage, and ability to time the market, there is also an element of risk associated with storing such high levels of inventory.
*Inventory number adjusted to reflect operational inventory.
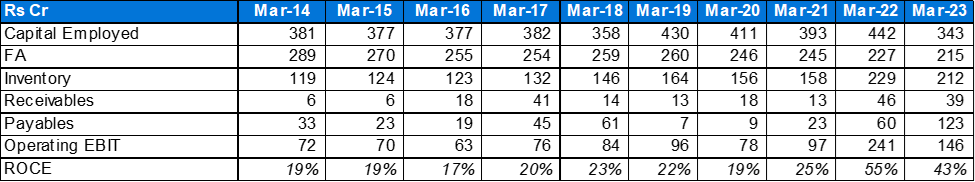
The company has generated healthy ROCE numbers over the years, consistently around the range of 20 – 25%.
Self-Sustainable Growth Rate is not relevant in the case of this company, as they are not deploying capital to grow the business.
Historical trend and outlook:
Generic cotton yarn industry trend:
India’s cotton yarn Industry recorded record high profitability in FY22, due to strong demand, lower domestic prices compared to international markets and USA’s ban on cotton products from China (which re-directed some demand directly to India, and Indirectly via Bangladesh).
However, in 2023, there were several challenges.
- Domestic cotton prices were higher than international prices.
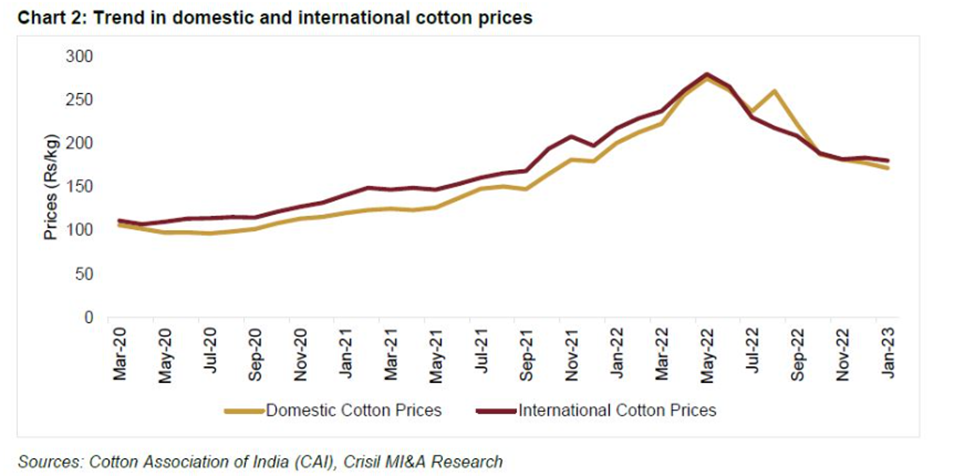
- Decline in global demand due to inflationary and recessionary pressures in the western economies, along with increase in energy and supply chain costs.
As a consequence, Indian spinners experiences margin contraction.
The graph below suggests that towards the end of FY23, the spread between cotton and yarn prices were back to the levels seen in Q4 FY21 and H1 FY22.
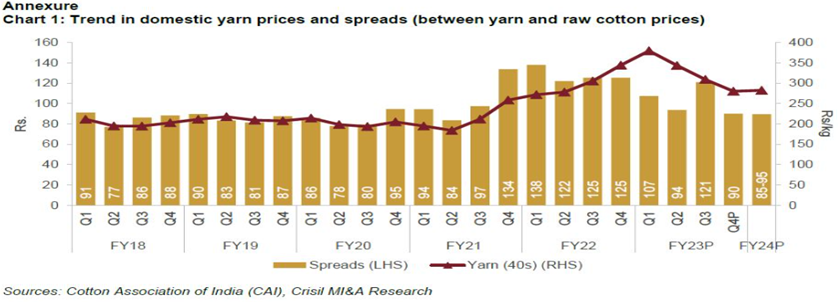
This is also substantiated by the quarterly margin fluctuations witnessed by some of the other Indian spinning mills.
Export data:
India’s cotton yarn exports hit a decade low of 664,000 tonnes in FY23 compared to highest exports of 1,389,999 tonnes in FY22.
Outlook for FY 24:
- Challenges are expected to persist in H1 2024, but there are a few positive demand drivers which will impact the industry in H2 2024 – alignment of Indian cotton prices with international prices, continued shift in USA’s demand from China and rebound in global demand from downstream industries.
- India’s yarn industry is likely to witness a 5 – 7 % volume growth, while operating margin is expected to recover by 100- 150 bps in FY24 over FY23.
Valuation:
As of 31st march, the company had
- Inventory of 396 Crores INR. (Out of which 165 Cr- Finished goods and 215 Cr – raw materials and CWIP).
- Cash and equivalents of 277 Crores INR.
- Total of cash and inventory is 673 Crores INR.
- Zero debt.
- Therefore, total value of cash and inventory, net of debt is 673 Crores.
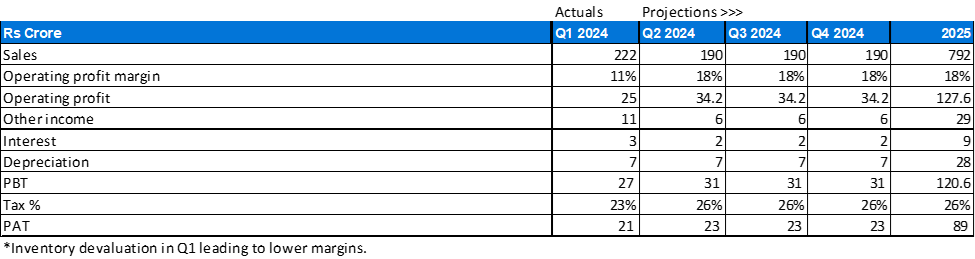
- Company made profits of 21 Crore in Q1 FY24.
Here is the most interesting part of the company:
- The market capitalisation of the company is 950 Crores.
- Adjusted for cash and inventory, and Q1 profits, net market cap is 256 Crores.
Based on industry outlook, we already know that sales volume is expected to pick up in H2 2024. With margin expansion in the range of 1-1.5%.
If we assume that in Q2 onwards, company can deliver quarterly sales in the range of 190 – 220 crores with operating margins back at 18% – 20% range, the company should generate 23 – 27 Crores of cash every quarter. Assuming and average of 25 Crores, on an annualised basis the company would generate ~100 Crores of cash.
If the trend sustains over the next 2.5 years, the company is available for free.
In other words, the company is trading at an adjusted PE of 2.5 times.
- Company is not growing, yes agree.
- But historically margins have been very solid.
- ROCE has been maintained in the range of 20%.
- There is no risk of leverage.
- Company has expertly navigated through all cotton price cycles.
- Management is ethical and has no history of corporate mis-governance.
Surely this company cannot trade at a price even remotely close to 950 crores in another 1.5 – 2 years. Will be interesting to see where the valuation stands in that time period.
Some parting thoughts on this business:
Follow up analysis, which are not a part of this writeup, but important to understand if investment horizon is longer than 2.5 – 3 years:
What should the company do with the cash:
- Management has time and again stated that they are waiting for a good acquisition opportunity, where the odds of success are high. They are waiting for such an opportunity and till they find one will continue to hold cash and invest excess cash in their inventory and FG inventory. – but for a company as conservative as Ambika Cotton, it is unlikely that they will go for an inorganic expansion under this management.
- Since most of the machinery is over a decade old, they might need to keep aside some capital for replacement capex, which will not add any capacity. – this needs to be validated.
- Company had done a buyback of shares once in 2017, but the stock already suffers form lack of liquidity. Which is why management does not prefer to buy back further shares.
- Company pays out healthy dividend (average of 23% between 2018 and 2023). Maybe they could explore paying out higher dividends if they are struggling to grow.
Concerns around management succession:
- Mr. P V Chandran, Chairman and MD is now over 70 years old. He along with his family owns 50.17% of the shares in the company.
- His daughters have been involved in the business for close to a decade now, but still does not hold a significant managerial position.
- Thought he promoter and the family are ethical and honest (as has been proven numerous times historically, when they refused to take special dividend, or lowered their salaries during stressful times), there is a serious concern over succession of management in the long run. Especially when the company has a very high part of its market cap in cash and inventories- which can be impacted by bad management decisions.
Could competition be coming in from Egypt/ LATAM etc. and further impact sales/ sales growth in the future?
